U.S. Flu Forecasts --- 2009 Week 37 (Produced 16 September)
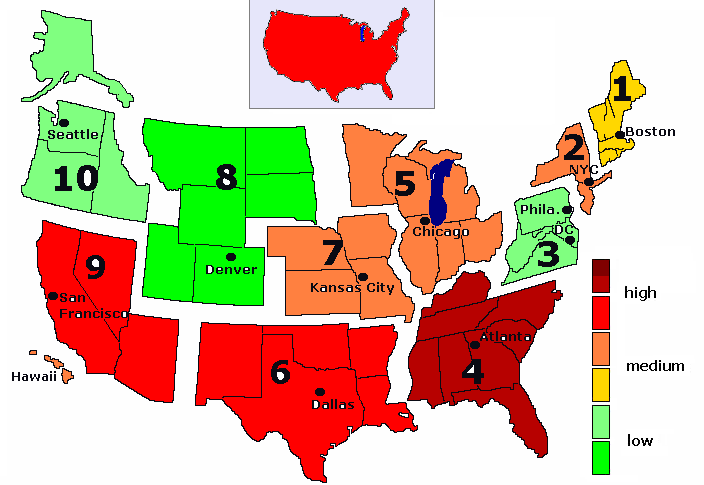
Regional Influenza Activity for week 37 (ending 19 September)
2009 Week 37 (nowcast)
Color coding is based on region-specific baselines. Green and yellow:
below baseline; orange: between baseline and 1.5 times baseline; red:
above 1.5 times baseline; dark red: above 3 times baseline; very dark red:
above 6 times baseline.
1 Summary for week 37 (ending 19 September)
The CDC reports in week 35 that the %weighted ILI
(the percentage of outpatient visits for influenza-like illness) stands at 3.55.
Google Flu Trends estimates ILI% for week 35 too low at 0.83.
During weeks 36 (ending 12 September) and 37 (ending 19 September),
influenza activity in the US has been rising rapidly.
The average week 36 nowcast is 4.8%, for week 37 it is 5.4%.
ILI% in the US is about double the national baseline of 2.4%, and
higher than the peak of last season.
Flu activity in 7 regions is above their region-specific baseline, based on week 37 nowcasts.
Only regions 3, 8, and 10 are below their baseline.
Flu activity in the US this winter will probably be higher than
experienced in the previous ten seasons.
2 Current Influenza Activity
Robustified Google Flu Trends (RGFT) shows a rapid increase of ILI%
in weeks 36 and 37: 4.7% and 5.1% respectively.
This is based on the changes in the logit of Google Flu Trends (GFT),
applied to the ILI% level reported in the CDC influenza report for week 35.
The rapid growth of the last three weeks is very well described by a linear
trend: the logit increased by 0.2, 0.4, 0.6 respectively.
This corresponds approximately with increases of 20%, 40% and 60% in
flu activity (ILI%).
In comparison, during the winter peak in a normal flu season (weeks 50-51 and 3-6),
there is an average weekly increase of about 20%.
This trend could not be clearly seen last week, but is now estimated
with high significance in the model M2.
The nowcasts make the assumption that the trend follows a 1,2,3,2,1 pattern
(multiplied by the estimated coefficient of 0.2).
Model M2 nowcasts, based on this trend, report a rapid increasing ILI%:
4.9% and 5.8% respectively.
This assumption is more realistic than that of
the previous week.
The average nowcasts for week 36 and 37, based on pooling a dynamic model with
calendar effects (M2) and RGFT, show a rapid increase in ILI%:
4.8% and 5.4% respectively.
During weeks 27 to 33, RGFT has produced better nowcasts than the pooled model.
Historically, the pooled model has performed better.
3 Expected Influenza Activity
Historically, there tends to be a fairly slow increase in ILI% until
Thanksgiving Day.
The Thanksgiving holidays are associated with an additional increase of 15%.
It is clear that this season is already developing in a very different way.
4 Flu Season Forecasts of Influenza Activity
The dynamic model M2 describes normal flu seasons quite well, but is
inappropriate during pandemic flu. For that reason, scenarios are reported.
The one-year ahead forecasts use
the average nowcasts for week 36 and 37 as the starting point for forecasting.
Then three assumptions are used to capture pandemic flu activity:
Medium 20%: the period of elevated activity lasts until Thanksgiving Day.
This is captured by a trend effect estimated over weeks 33 to 37
which is increasing until week 35 then decreasing. From week 37
until Thanksgiving Day 0.2 is added to the intercept (a 20% increase in ILI).
This is the dotted blue line.
Note that Thanksgiving Day is usually associated with an increase in flu activity.
Long 20%: the period of elevated activity is extended until the week
before Christmas, the solid blu line.
Long 25%: the coefficient is increased from 0.2 to 0.25, and runs
until the week before Christmas (the dotted purple line).
Note that the dynamics in the model effectuates a moderating effect
after a longer period of very rapid increase.
If these assumptions hold, very high levels of ILI% should be expected.
The results reported here are based on forecast, and
are therefore uncertain. These results are my personal opinion, based on extensive
modeling, and not endorsed by either the CDC or Google.